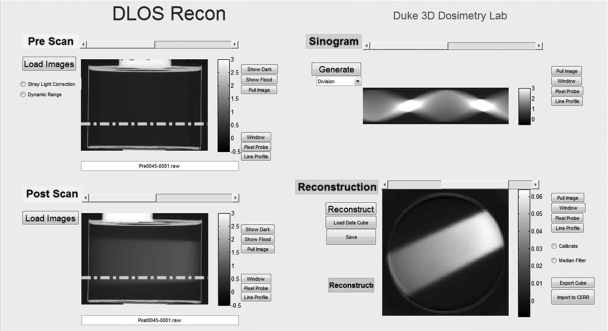
Figure 2.
DLOS reconstruction graphical user interface. Upper left quadrant displays projection images associated with the preirradiation scan, and the lower left displays projection images of the postirradiation scan. In this example, the dosimeter was irradiated with a single open beam incident on the side of the dosimeter (from right to left in the projection image lower left panel). The stray-light correction is applied to each prescan and postscan projection prior to reconstruction. The right column displays the ratio sinogram (upper panel) with units of μ·x, and reconstructed slice (lower panel) in units of μ (pixel−1) associated with the row indicated by the dashed line on the projection images.

