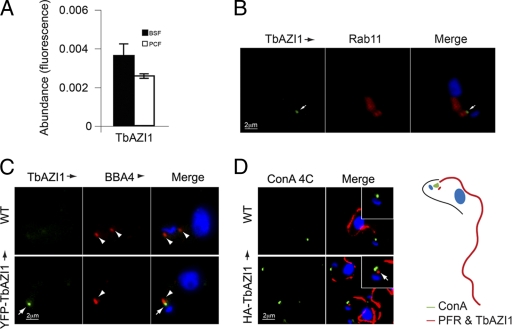
Fig. 5.
TbAZI1 transcript levels and endocytic location. (A) Abundance of TbAZI1 mRNA in bloodstream (filled bars) and insect (open bars) forms was assayed by quantitative RT-PCR using tubulin as an internal standard, as previously. TbAZI1 is equally expressed in both insect and mammalian stages. Error bars are standard error from experiments performed in triplicate. (B) Location of HA epitope-tagged TbAZI1 by immunostaining with mouse anti-HA antibody (green, white arrows). Cells were counterstained with rabbit polyclonal anti-Rab11 (center panels, red), DNA was visualized with DAPI (blue, right panels, merge). (C) Wild-type (WT) bloodstream-form cells or cells expressing YFP-TbAZI1 (green, white arrows) were fixed and prepared for immunofluorescence. Cells were then stained with mouse BBA4 antibody that labels the basal body (red, arrowheads). DNA was visualized with DAPI (blue, right panels, merge). (D) Wild-type cells or cells expressing HA-TbAZI1 were incubated with concanavalin A (green) at 4°C for 20 min to stain the lumen of the flagellar pocket. Cells were then processed for immunofluorescence analysis and counterstained with mouse antibody L8C4 specific for the paraflagellar rod (red) and anti-HA antibody for HA-TbAZI1 (red dot in lower panels, arrow). Note the essentially identical locations of HA-TbAZI1 (B and D) and YFP-TbAZI1 (C), eliminating the possibility of mistargeting based on the presence of the epitope tag. Bars, 2 μm.

