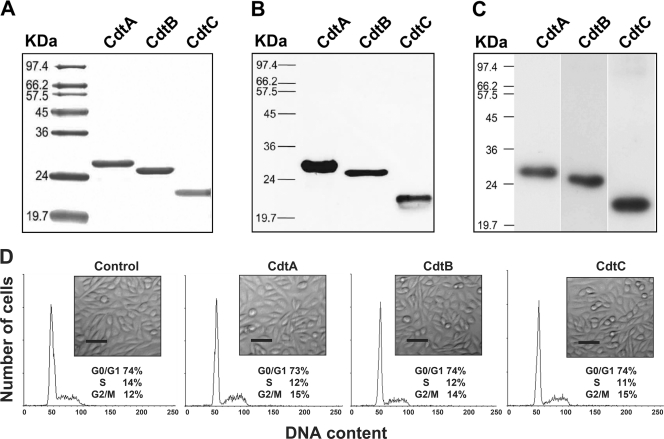
Fig. 1.
Purification and characterization of each recombinant C. jejuni CDT subunit. (A) CDT proteins were expressed and purified as described in Materials and Methods. Each CDT subunit (2 μg/ml) was subjected to SDS-PAGE and stained with Coomassie brilliant blue. (B) Recombinant CDT protein (2 μg/ml) was loaded into each lane and verified by Western blot analysis with a monoclonal antibody specific to the His tag. (C) Western blot analysis was conducted on extracts of CHO-K1 cells exposed to the CDT holotoxin and assessed by antisera against CdtA, CdtB, or CdtC. Molecular mass markers (kDa) are shown on the left. (D) CHO-K1 cells were untreated (control) or treated with 200 nM each purified recombinant subunit at 37°C for 48 h. The cells then were examined under an inverted optical microscope to assess the effects of each CDT subunit. The cell cycle distribution was based on the DNA content, which was determined by flow cytometry. The percentage of cells in the G0/G1, S, and G2/M phases of the cell cycle are indicated below the insets. Scale bar, 50 μm. The results represent one of three independent experiments.

