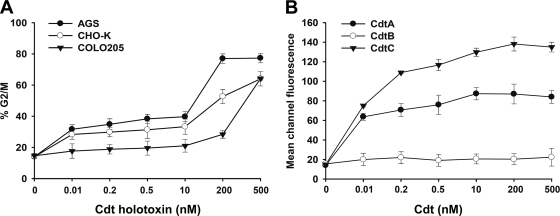
Fig. 3.
CDT intoxication and binding of cells. (A) Cells from the indicated lines were treated with various concentrations of CDT holotoxin (0.01 to 500 nM) and incubated at 37°C for 48 h. Cell cycle distribution was based on the DNA content, which was determined using flow cytometry. The percentage of cells in the G2/M phase was calculated. (B) CHO-K1 cells were exposed to each CDT subunit at the indicated concentrations (0.01 to 500 nM) and incubated at 4°C for 2 h. The cells were stained with individual antiserum against each CDT subunit followed by staining with FITC-conjugated anti-mouse IgG. The binding activity of each CDT protein was assessed by flow cytometry for FITC fluorescence. The results represent the means and standard deviations from three independent experiments.

