Fig. 8.
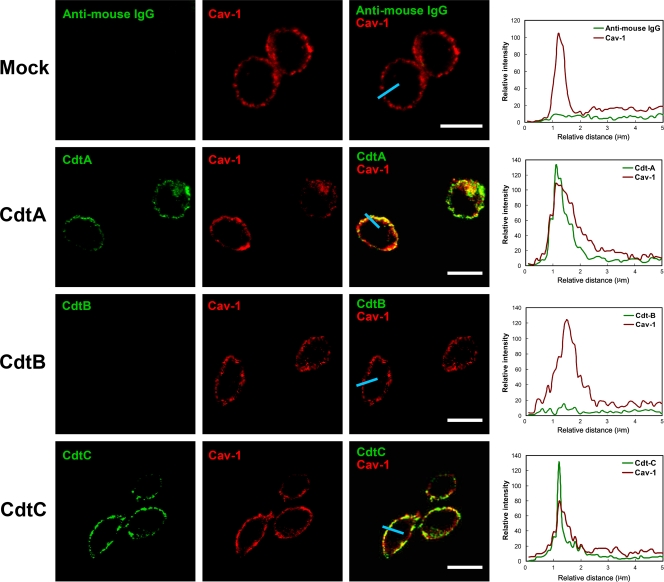
Association of CdtA and CdtC with membrane rafts. CHO-K1 cells were exposed to medium alone or 200 nM each recombinant C. jejuni CDT subunit at 11°C for 1 h. The cells were washed and treated with control preimmune serum or each anti-CDT antiserum and then probed with FITC-conjugated anti-mouse IgG (green). The cells were costained with anti-caveolin-1 and Alexa Fluor 647-conjugated anti-rabbit IgG to visualize the raft microdomains (red) and analyzed by confocal microscopy. The colocalization of each CDT subunit with lipid raft domains appears as yellow in the overlay. Scale bars, 10 μm. The distribution of fluorescence intensity for each CDT subunit and Cav-1 signals across the blue lines were calculated and are presented as line intensity histograms in the right panels. Cav-1, caveolin-1.

