Fig. 1.
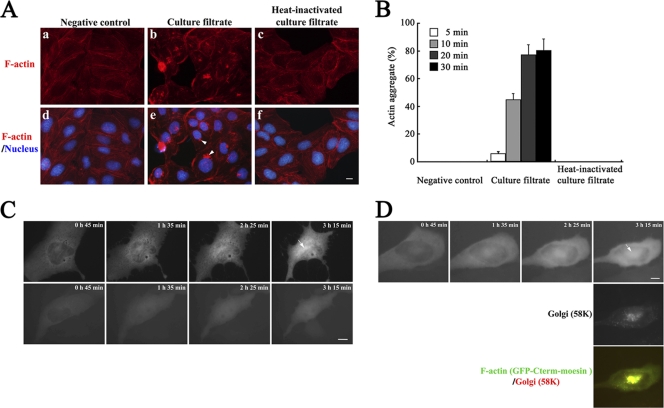
Formation of actin aggregate at the juxtanuclear region in C. difficile culture filtrate-treated MDCK cells. (A) F-actin distribution in control cells (bacterium-free culture medium-exposed MDCK cells) (left panels), C. difficile culture filtrate-exposed MDCK cells (middle panels), and heat-inactivated C. difficile culture filtrate-exposed MDCK cells (right panels) after 30 min of culture filtrate exposure following medium replacement and 3 h of incubation. Images of TRITC-phalloidin-labeled F-actin (top panels) and merged images of DAPI-labeled nucleus with F-actin (bottom panels) are shown. The arrowheads in panel e indicate actin aggregate. Bar, 5 μm. (B) MDCK cells were treated with each preparation of culture filtrate in panel A for the indicated exposure times and further incubated for 3 h followed by labeling with TRITC-phalloidin and DAPI. The percentage of cells that formed actin aggregate was calculated. Results are means ± SD for three independent measurements. (C) Live-cell analysis of F-actin organization after C. difficile culture filtrate treatment (top panels) or 400 ng/ml toxin B treatment (bottom panels). Fluorescence images of GFP-Cterm-moesin-labeled F-actin are shown for each of the time points of observation. The arrow indicates actin aggregate. Bar, 5 μm. (D) After live-cell analysis of F-actin organization, cells were fixed and immunolabeled with anti-Golgi region 58K protein antibody and secondary Texas Red-conjugated antibody. Fluorescence images and the merged image (top, F-actin; middle, Golgi region; bottom, F-actin/Golgi region) are shown. The arrow indicates actin aggregate. Bar, 5 μm.

