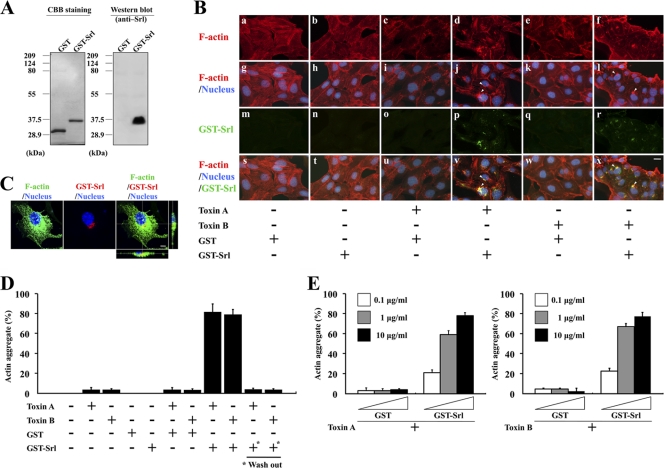
Fig. 4.
Treatment with GST-Srl and either toxin A or toxin B triggers increased formation of an actin aggregate in cells. (A) Purified GST-Srl was subjected to SDS-PAGE and CBB staining or Western blotting. For CBB staining, 0.2 μg purified protein was loaded on the gel. For Western blotting, a 1:10 dilution of the samples was used. (B) MDCK cells were treated for 3 h with 10 μg/ml GST-Srl or GST in the absence or presence of 750 ng/ml toxin A or 300 ng/ml toxin B and then subjected to immunofluorescent microscopy using anti-Srl antibody. F-actin and DNA were stained with TRITC-phalloidin and DAPI, respectively. Fluorescence images and the merged images are shown. Bar, 10 μm. Arrowheads in panels j and l indicate actin aggregates. Arrowheads in panels v and x indicate the sites of accumulation of GST-Srl. (C) Subcellular localization of GST-Srl. MDCK cells treated with 10 μg/ml GST-Srl plus 300 ng/ml toxin B for 3 h were stained with Alexa 488-phalloidin (green), an anti-Srl antibody (red), and DAPI (blue). Bar, 5 μm. (D) MDCK cells were treated for 3 h with 750 ng/ml toxin A, 300 ng/ml toxin B, 10 μg/ml GST-Srl, 10 μg/ml GST alone, or indicated combinations of GST-Srl or GST and either toxin, and the percentage of cells that formed an actin aggregate was calculated. Results are means ± SD of three independent measurements. + and − denote positive and negative results, respectively. *, MDCK cells that were pretreated for 3 h with 10 μg/ml GST-Srl, after which GST-Srl was washed off before either toxin A or B was added. (E) MDCK cells were treated for 3 h with the indicated concentrations of GST-Srl or GST in the presence of either 750 ng/ml toxin A or 300 ng/ml toxin B, and the percentage of cells that formed an actin aggregate was calculated. Results are means ± SD of three independent measurements.

