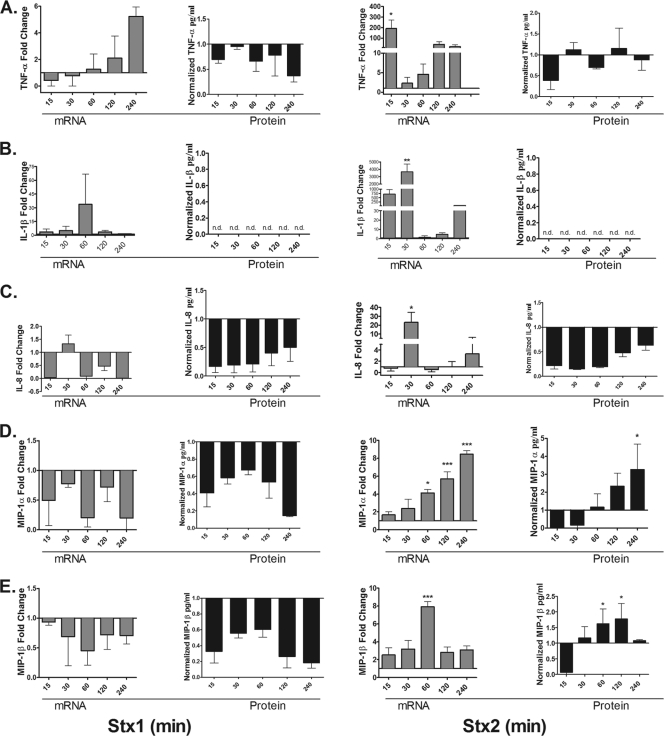
Fig. 5.
Cytokine and chemokine production elicited by Stx1 and Stx2 treatment of HK-2 cells. HK-2 cells were stimulated with 75 pg/ml of either Stx1 or Stx2 for 15, 30, 60, 120, or 240 min. Total RNA was isolated, DNase treated, and cDNA synthesized. Quantitative real-time PCR was performed with primers specific for TNF-α (A), IL-1β (B), IL-8 (C), MIP-1α (D), MIP-1β (E), and the internal control GAPDH. Relative expression was calculated using the ΔCT method and expressed as fold change relative to untreated-control levels (gray bars). The data were derived from at least two independent experiments. Cell supernatants were collected and analyzed for TNF-α, IL-1β, IL-8, MIP-1α, and MIP-1β proteins as described in Materials and Methods (black bars). The data shown are the mean fold change ± SEM derived from three independent experiments. Statistical significance was calculated using one-way ANOVA (*, P < 0.05; **, P < 0.01; ***, P < 0.001).

