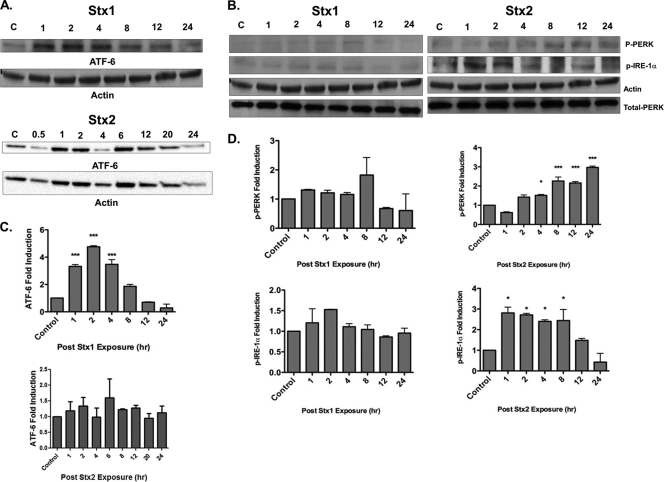
Fig. 6.
UPR sensors are differentially activated after Stx1 or Stx2 exposure in HK-2 cells. (A and B) HK-2 cells were stimulated with 75 pg/ml Stx1 or Stx2, and at the indicated time points, cells were lysed and whole-cell lysates (100 μg/well) were subjected to SDS-PAGE (4% to 20%) and probed using antibodies specific for the activated forms of the UPR signaling molecules ATF6 (50 kDa) (A), phospho-PERK (170 kDa) (B), and phospho-IRE1α (110 kDa). The blots shown are characteristic of at least three independent experiments. (C and D) Mean densitometric readings of Western blot band intensities from three independent experiments. The data are expressed as means plus SEM; statistical significance was calculated using one-way ANOVA (*, P < 0.05; ***, P < 0.001) compared to control untreated cells.

