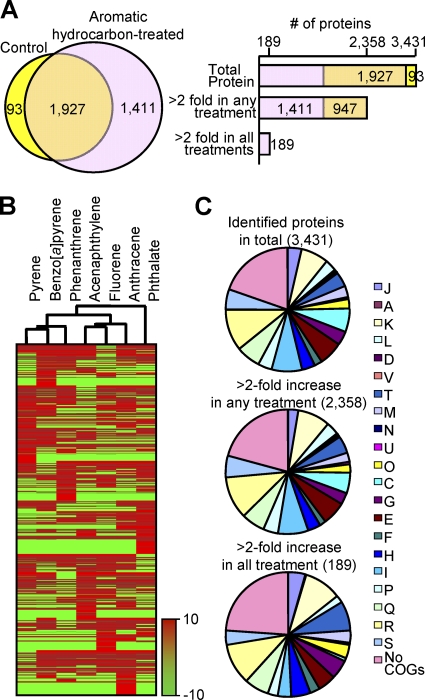
Fig. 1.
Summary of proteins identified in this proteome study. (A) Venn diagram showing numbers of proteins identified in control samples and aromatic hydrocarbon-treated samples treated with phthalate, fluorene, acenaphthylene, anthracene, phenanthrene, pyrene, and benzo[a]pyrene. The bar graph shows a comparative analysis of protein expression profiles (explained in detail in the text). (B) Heat map of proteomic data sets. Cluster analysis shows similarities of protein expression between samples. (C) Pie chart showing observed proteins based on COG functions. COG category descriptions are provided in Table S1 in the supplemental material.

