Fig. 2.
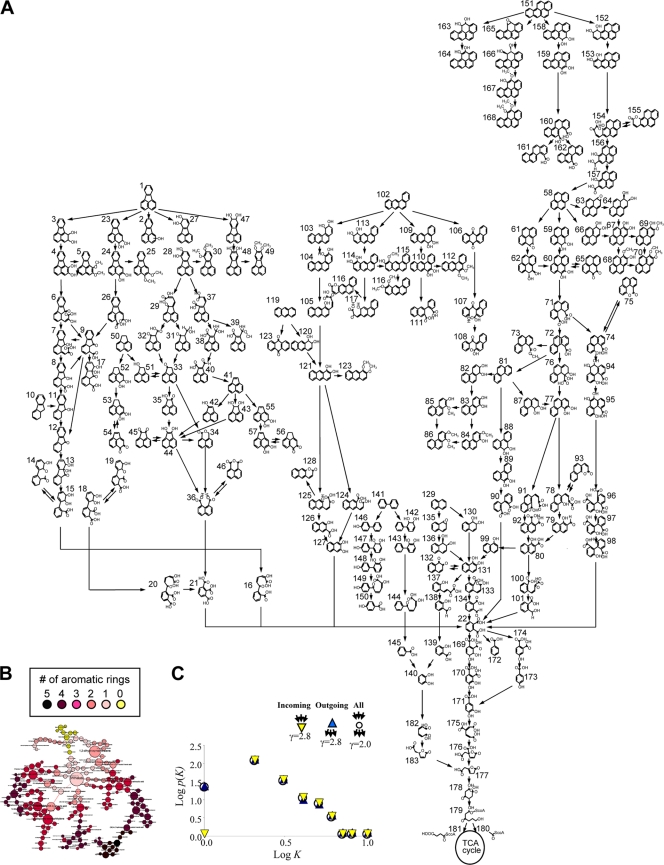
PAH-MN in M. vanbaaleniiPYR-1 (183 nodes and 224 edges). (A) The reconstructed PAH-MN of M. vanbaaleniiPYR-1. Names of PAHs and their metabolites are given in Table S3 in the supplemental material. (B) Scale-free PAH-MN showing the highlighted larger-sized hubs. The color and size of the nodes indicate benzene ring number and connectivity, respectively. For example, the main hub node, phthalate, which shows high connectivity with an in-degree of 7 and out-degree of 3, was shown to be the biggest yellow node in size and color. (C) Log-log plots showing the number of compounds versus connectivity. Connections involved either as a substrate or as a product are counted. The exponents of the power law distribution (γ) are shown. k, connectivity; P(k), number of compounds. Cytoscape (http://www.cytoscape.org/) was used for network analysis and visualization.

