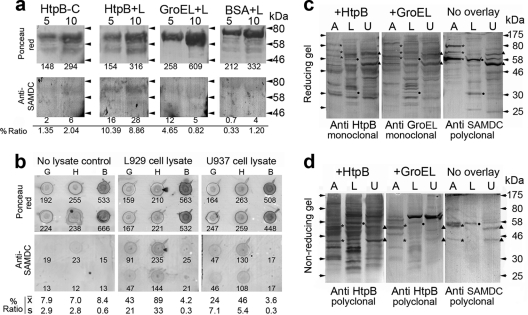
Fig. 5.
HtpB interacts with mammalian SAMDC. (a) Far-Western blot assay with 5 or 10 μg of immobilized purified proteins (HtpB, GroEL, and BSA) overlaid with a lysate of L929 cells (L). The negative control for the SAMDC immunostaining signal was prepared with purified HtpB exposed to buffer instead of lysate (HtpB-C). The small number under each lane is the densitometry reading for the upper band representing full-size chaperonin or BSA. Differences in loading and blotting efficiency were controlled for by calculating the percent ratio of the immunostaining signal over the Ponceau-S staining signal (values under the anti-SAMDC membranes/values under the Ponceau red membranes × 100). The horizontal arrowheads indicate the positions of marker proteins run between samples, and their molecular masses are indicated on the right in kDa. (b) Dot blot assay showing 10 μg of immobilized GroEL (G), HtpB (H), or BSA (B) overlaid with L929 or U937 cell lysate. The control for the negative SAMDC immunostaining signal was prepared with immobilized proteins overlaid with buffer (no-lysate control). The percent ratio of the immunostaining signal over the Ponceau-S staining signal was calculated as described for panel a and is shown as the mean (x̄) and standard deviation (s) (n= 2). Shown are reverse far-Western assays of immobilized host cell proteins separated by SDS-PAGE under reducing (c) or nonreducing (d) conditions overlaid with purified HtpB and GroEL and immunostained with the indicated antichaperonin antibodies. The no-overlay membranes show the protein bands recognized by the anti-SAMDC antibody, whose positions are indicated by asterisks for amoebae (A), black dots for L929 cells (L), and black triangles for U937 cells (U). Arrowheads indicate the positions of marker proteins whose masses are indicated on the right in kDa.

