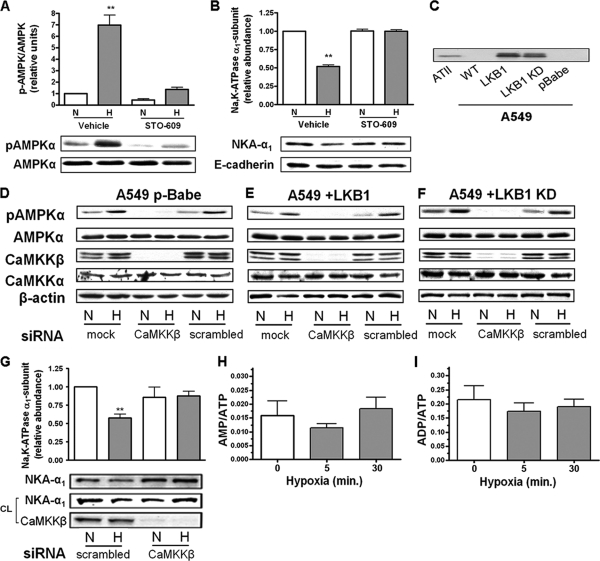
Fig. 1.
Hypoxia-induced activation of AMPK is Ca2+/CaMKKβ dependent. (A) ATII cells were exposed to 21% (N) or 1.5% (H) O2 for 10 min in the presence or absence of STO-609 (20 μM, 30-min preincubation). The graph represents activation of AMPK measured as the ratio of AMPK phosphorylation at Thr-172 (pAMPKα) and total AMPKα by Western blot analysis. Values are expressed as means ± SEM (n = 4). **, P < 0.01. Representative Western blots for phosphorylation of AMPK and total AMPK protein levels are shown. (B) ATII cells were exposed to 21 or 1.5% O2 for 60 min in the presence or absence of STO-609. The Na,K-ATPase α1 subunit (NKA-α1) plasma membrane abundance was determined by cell surface biotinylation followed by streptavidin pulldown and Western blot analysis using specific antibodies. Representative Western blots of the NKA-α1 at the plasma membrane and E-cadherin as a loading control are shown. Results are means ± SEM (n = 4). **, P < 0.01. (C) Western blot showing the expression of LKB1 in alveolar epithelial cells. (D to F) A549 p-Babe (D) A549+LKB1 (E), and A549+LKB1 KD (F) cells were transfected with siRNA against CaMKKβ or scrambled siRNA, and 48 h later cells were exposed to 21 or 1.5% O2 for 10 min. pAMPKα and total AMPKα were determined by Western blotting. β-Actin was used as a loading control. (G) A549+LKB1 cells transfected with CaMKKβ siRNA were exposed to hypoxia, and Na,K-ATPase protein expression was assessed as for panel B. Values are expressed as means ± SEM (n = 4). **, P < 0.01. (H and I) AMP/ATP (H) and ADP/ATP (I) ratios in ATII cells exposed to 1.5% O2 for 0, 5, and 30 min were assessed by HPLC (n = 6).

