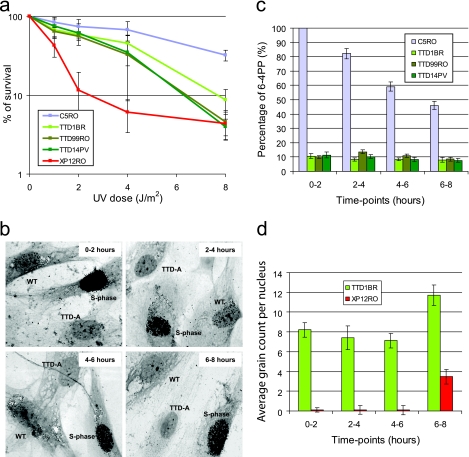
Fig. 1.
Time-lapse UDS capacity. (a) Graph showing the surviving fraction of cells after different doses of UV irradiation of wild-type C5RO, TTD-A, and XP-A primary fibroblasts. The percentage of surviving cells was plotted against the applied UV dose, measured by [3H]thymidine incorporation. The error bars indicate the standard errors of the mean (SEM). (b) Representative pictures of UDS experiments of TTD-A (TTD1BR) mixed with WT (C5RO) primary fibroblasts at different time points, as indicated, after UV irradiation. WT cells are recognized by the presence of small beads in the cytoplasm, and the heavily labeled cells are in S phase. (c) Graph showing the relative UDS levels at different time points after UV irradiation obtained after counting the autoradiographic grains above the nuclei expressed as percentages of wild-type UDS measured directly after UV irradiation, which was set at 100%. The UDS levels of the different TTD-A primary fibroblasts are indicated in green. The error bars indicate the SEM of at least 25 nuclei counted. (d) Graph showing the absolute UDS levels at different time points after UV irradiation obtained after counting the autoradiographic grains above the nuclei of TTD-A (TTD1BR) and XP-A (XP12RO) primary fibroblasts. The error bars indicate the SEM of at least 50 nuclei counted.

