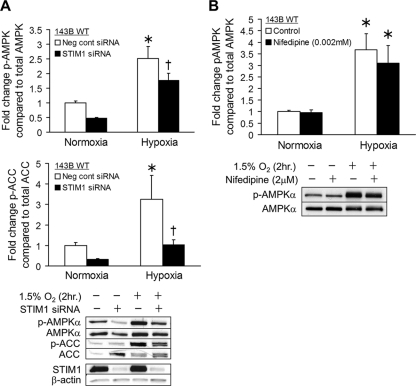
Fig. 12.
Role of STIM1 in hypoxia-induced AMPK activation. (A) 143B cells were transfected with negative-control siRNA (white bars) or siRNA for STIM1 (black bars) and exposed to hypoxia (1.5% O2) or normoxia (21% O2) for 2 h. Levels of AMPK phosphorylated at Thr-172 (p-AMPKα) and of ACC phosphorylated at Ser-79 (p-ACC) as well as total AMPKα and ACC were measured by Western blotting. Graphs depict the fold change in the p-AMPK/AMPK or p-ACC/ACC ratio. Representative Western blots are shown. Values are expressed as means ± SEM (n = 6). *, P < 0.05 compared to normoxia control; †, P < 0.05 compared to hypoxia control. (B) Control 143B cells (white bars) and 143B treated with nifedipine (black bars) were analyzed for AMPK activation during hypoxia as for panel A. Graphs depict the fold change in p-AMPK/AMPK ratios. Representative Western blots are shown. Values are expressed as means ± SEM (n = 4). *, P < 0.05 compared to normoxia control.

