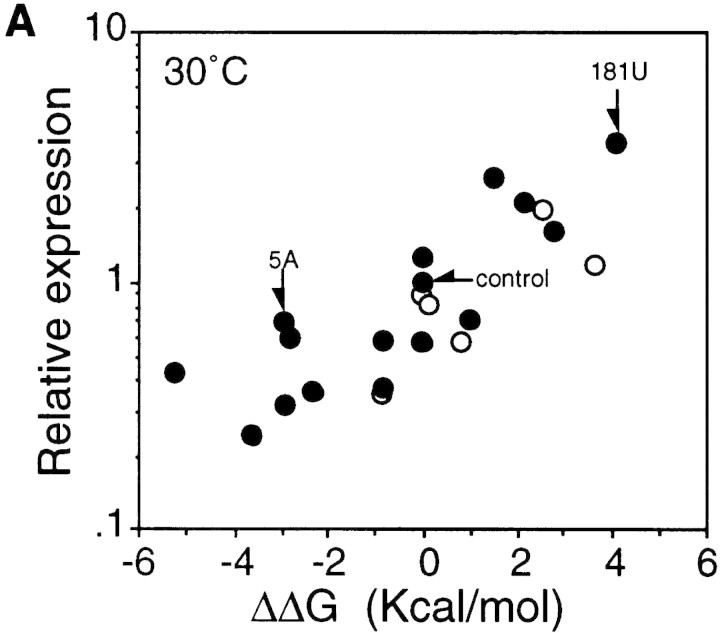
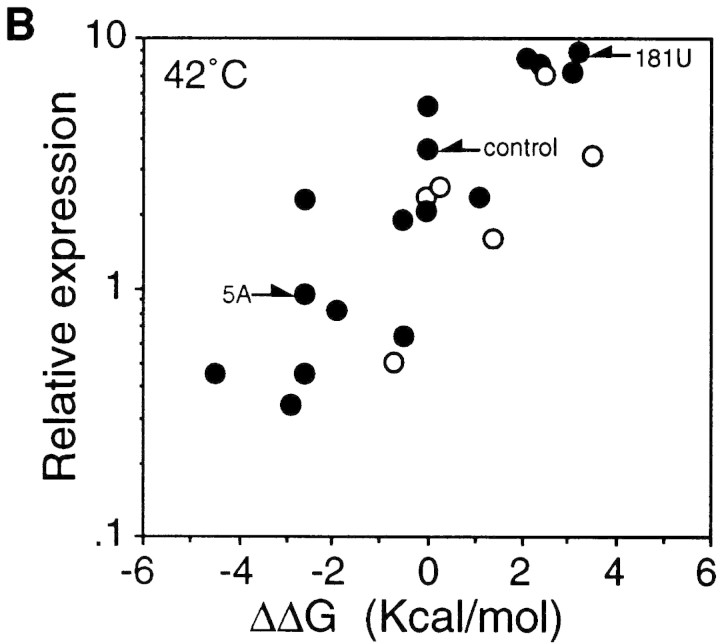
Figure 2.
Correlation between the predicted stability of mRNA secondary structure and synthesis rates of fusion proteins from the minimal fusion constructs at 30°C (A) and 42°C (B) based on the results shown in Table 1. The log of relative synthesis rate was plotted against differences in the predicted stability of the rpoH portion of the mRNA between each mutant and control. (Arrows) Control or mutant constructs used in Fig. 3. ΔΔG values were as described in footnote a to Table 1; the values at 42°C used in B were slightly different from those at 30°C. (○) Expression from fusions carrying mutation(s) in region A (see footnote b in Table 1).


