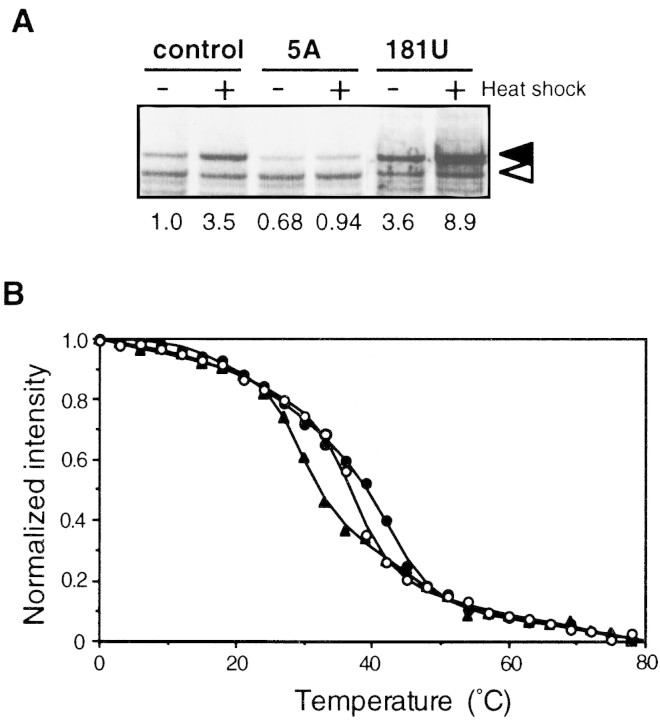
Figure 3.
Expression and thermoregulation in vivo and mRNA thermostability in vitro of the minimal fusion constructs. (A) SDS-PAGE patterns of fusion proteins expressed from TLF229Δ(stemII)GG (control) and its derivatives with the super-repressed (5A) or derepressed (181U) phenotype (see Table 1). Cells were grown at 30°C, shifted to 42°C, and synthesis rates of fusion protein were analyzed as in Fig. 1. (Solid and open arrows) Fusion protein and β-galactosidase ω protein (internal reference), respectively. (B) Temperature profiles of CD spectra at 255 nm for the 5′ portion (nucleotides −20 to +229) of mRNA from each fusion. Higher intensity reflects folded structure, and lower intensity indicates melting of RNA duplexes. (○, ●, ▴) Control, 5A, and 181U, respectively. CD spectra were determined, and data were processed as described in Materials and Methods.

