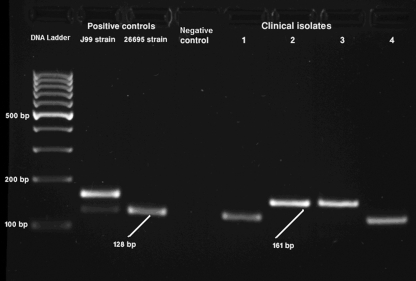
Fig. 1.
Genotyping of homA and homB in H. pylori isolates. The image is from a representative gel electrophoresis of PCR amplification products of homA (128 bp) and homB (161 bp) genes from clinical isolates and J99 and 26695 as positive-control strains for both homA and homB and only homA, respectively. The negative-control lane represents a PCR performed with no template DNA.

