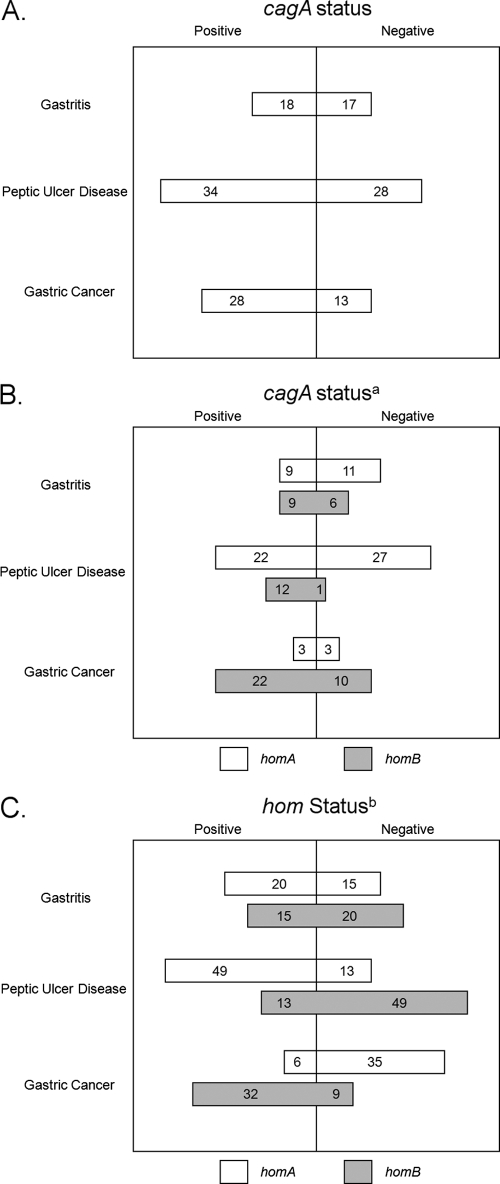
Fig. 2.
Schematic depiction of the distribution of the different virulence factors stratified by disease state within the Iranian population of this study. (A) The distribution of the cagA gene stratified by disease state is depicted. (B) The distribution of cagA, homA, and homB stratified by disease state is depicted. Only homA- or homB-positive strains are depicted among the cagA-positive or -negative isolates. a, positive correlation between the presence of the cagA gene and the homB gene (r = 0.243) and an inverse correlation between the presence of the cagA gene and the homA gene (r = −0.279). (C) The distribution of the different hom genes stratified by disease state is depicted. b, a significant association exists between the distribution of the homA gene and disease state (P < 0.0001) and the distribution of the homB gene and disease state (P < 0.0001), and the progression to gastric cancer is influenced by the presence of the homB gene.

