
Fig. 3.
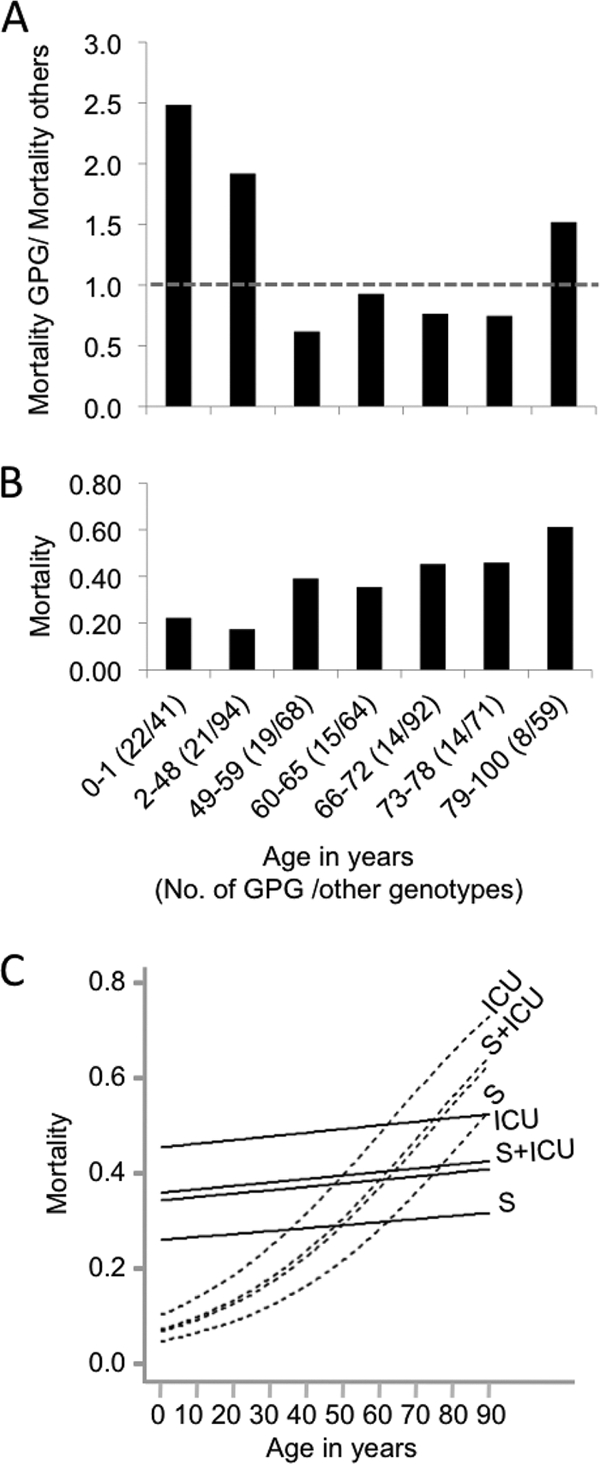
Higher mortality is associated with GPG isolates in young patients. (A) Mortality in different age groups of patients with GPG isolates relative to that of patients with non-GPG strains. The dashed line indicates a ratio of 1.0. (B) Overall mortality of patients of different ages. Numbers in parentheses after the age range are the numbers of GPG isolates and non-GPG isolates in the cohort. Age ranges were set so that at least 5 deaths of patients with GPG strains occurred in each cohort. (C) Plot of dependence of mortality on age, as deduced from logistic regression, for ICU patients, ICU patients who had undergone surgery (S+ICU), non-ICU patients who had undergone surgery (S), and non-ICU patients who had not undergone surgery (unlabeled). Solid lines indicate the mortality of patients with GPG strains, and dashed lines indicate the mortality of patients with non-GPG strains. Patients with borderline strains were excluded from these analyses.