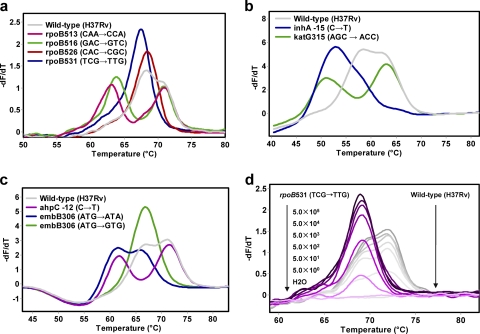
Fig. 2.
Detection of mutations in M. tuberculosis with the duplex reactions (the temperature increase rates were 0.5°C/s for reaction I and 1°C/s for reactions II and III). (a) Melting curve analysis from reaction I with probes rpoP1 and rpoP2; (b) melting curve analysis from reaction II with probes katP and inhP; (c) melting curve analysis from reaction III with probes embP and ahpP; (d) melting curves of reaction I with wild-type and rpoB531 (TCG → TTG) mutant M. tuberculosis strains with genomic DNA at from 5.0 × 10⁵ to 5.0 × 100 copies per reaction mixture.

