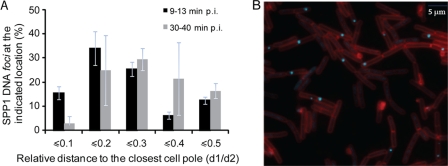
Fig. 7.
Localization of phage SPP1delX110lacO64 DNA in B. subtilis-infected cells. (A) Percentage of SPP1 DNA spots at the indicated distance relative (d1/d2) to the closest cell pole (old cell pole or closed new septum) on the bacterial cell, as observed by fluorescence microscopy (B). Measurements from three independent infections were carried out as schematized in Fig. 2B at early (▪; 200 cells with a single SPP1 DNA spot were measured from images taken between 9 and 13 min p.i.) and late ( ; 200 cells with a single SPP1 DNA spot were measured from images taken between 30 and 40 min p.i.) time points after infection. (B) Cells producing LacI-CFP (cyan) were infected by phage SPP1delX110lacO64 (input multiplicity of 3) and imaged at a late time point after infection (between 30 and 40 min p.i.). The cell outline was visualized with the vital membrane stain FM4-64FX (red).

