Fig. 4.
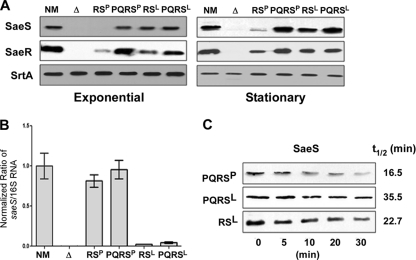
SaeSP is unstable. (A) Expression of SaeS and SaeR proteins from the complementation plasmids. Cells were collected at both exponential and stationary growth phases. SaeS and SaeR in the cells were analyzed by Western blot analysis. The sortase A protein (SrtA) was used as a loading control. NM, wild-type strain; Δ, sae deletion mutant NMΔsae; RSP, NMΔsae(pCL-RSP); PQRSP, NMΔsae(pCL-PQRSP); RSL, NMΔsae(pCL-RSL); PQRSL, NMΔsae(pCL-PQRSL). (B) Comparison of saeS transcript levels produced by the complementation plasmids. Total RNA was extracted from the indicated cells; then, the levels of saeS transcripts were compared by real-time qRT-PCR. As a control, 16S rRNA was used. Error bars represent standard deviations. (C) Comparison of the half-lives of SaeSP and SaeSL. Protein synthesis in strains NMΔsae(pCL-PQRSP), NMΔsae(pCL-PQRSL), and NMΔsae(pCL-RSL) was blocked with erythromycin; then, the expression level of SaeS was measured by Western blot analysis at the time points indicated. Half-life was calculated by densitometry analysis.

