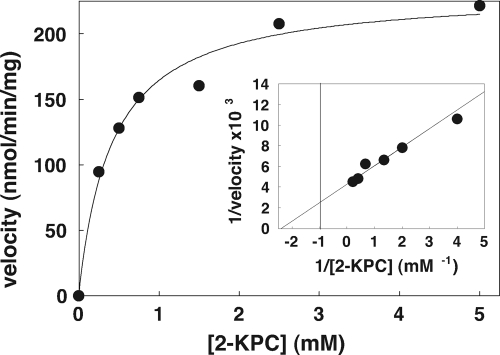
Fig. 5.
Effect of 2-KPC concentration on the reductive cleavage and carboxylation of 2-KPC to acetoacetate and CoM. All assays were performed with 0.089 mg of 2-KPCC. The line through the data points was generated by nonlinear least-squares fitting to a rectangular hyperbola. Inset, double-reciprocal plot of the data. The line through the data points was also generated by nonlinear least-squares fitting of the data.

