Fig. 4.
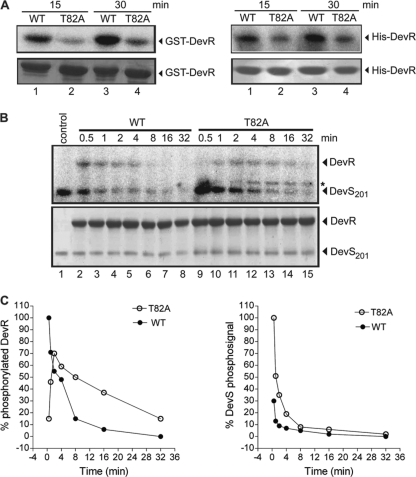
Time course of phosphorylation and dephosphorylation of DevR T82A and WT proteins. (A) In vitro phosphorylation of GST- (left) and His6- (right) tagged DevR proteins was carried out using [32P]acetyl phosphate for 15 min (lanes 1 and 2) and 30 min (lanes 3 and 4). (B) Phosphorylation of GST-DevR WT (lanes 2 to 8) and GST-DevR T82A (lanes 9 to 15) in the presence of DevS. Lane 1 contains ∼15 μM DevS autophosphorylated in the presence of [γ-32P]ATP. In panels A and B, the top and bottom portions represent phosphorimage and Coomassie stained gel, respectively. * in panel B represents a minor contaminant in GST-DevR T82A that was not detectable by Coomassie staining. (C) Data (described above for panel B) of phosphorylation and dephosphorylation of mutant and WT proteins (left) and the residual phophosignal in DevS after phosphotransfer to DevR (right). Each experiment was repeated at least thrice. and representative figures are shown.

