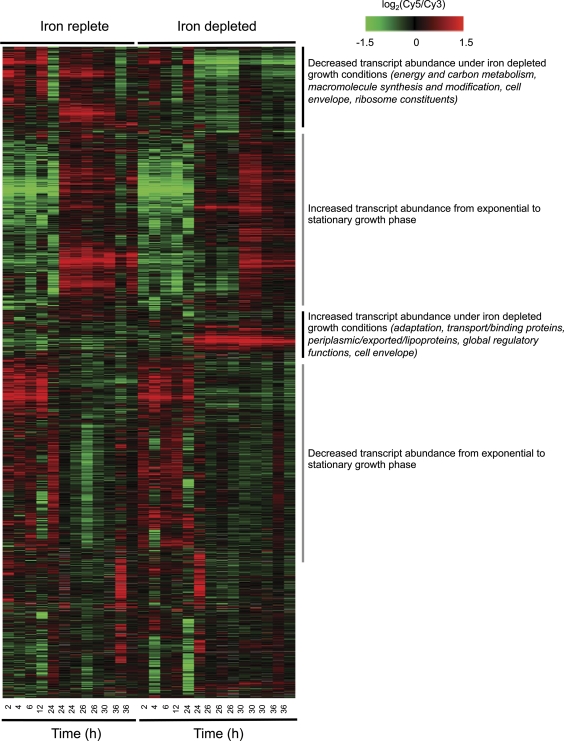
Fig. 2.
Gene transcript abundance patterns in B. pertussis Tohama I. Gene transcript abundance patterns in B. pertussis Tohama I are shown for cultures grown under iron-replete and iron-depleted conditions. Rows correspond to array elements, and major functional categories for groups of genes and their predicted products are indicated on the right. Some genes are represented by multiple array elements. Gray indicates missing data. The elapsed time since the culture was started is indicated at the bottom.

