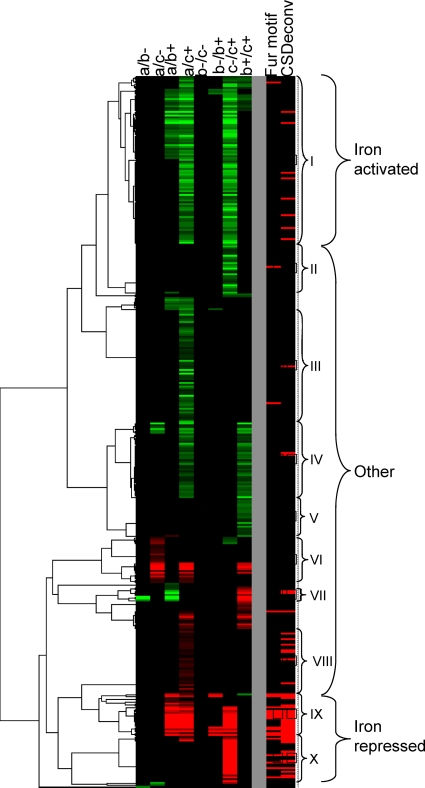
Fig. 5.
Clustering of transcripts based on differential expression at time points taken before (a) and 30 min (b) or 4 h (c) after the addition of sodium citrate (−) or ferric citrate (+) to DC3000 grown in MG medium (adapted from reference 3). Roman numerals show cluster groups that appeared to be regulated in a similar manner (see reference 3 for discussion of these clusters). The panel to the right shows whether these genes are associated with a computationally derived Fur motif (3) or with a peak identified by CSDeconv from the ChIP-seq data (this study).

