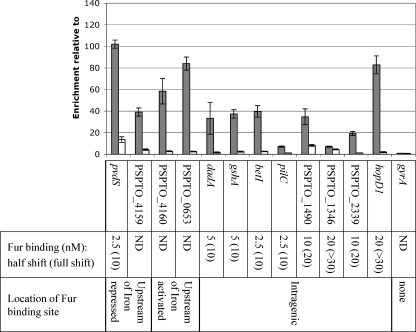
Fig. 7.
qPCR performed on ChIP samples from cultures grown with iron citrate (+ Iron; gray) or sodium citrate (− Iron; white) for 30 min. Enrichment of selected Fur binding regions is calculated relative to DNA sequences within the gap1 gene after immunoprecipitation with Fur-FLAG-tagged strains. No enrichment is observed of DNA within the gyrA gene. Shown below are the estimated Fur concentrations (nM) at which half shift and complete shift of a radiolabeled probe was observed after EMSA (see Fig. S2 in the supplemental material). For comparison, EMSA of other intergenic probes can be seen in Fig. 4B. Nonspecific shift of a PSPTO_1900 probe was observed only at concentrations of 50 nM Fur and higher (Fig. 4B). ND, not done.

