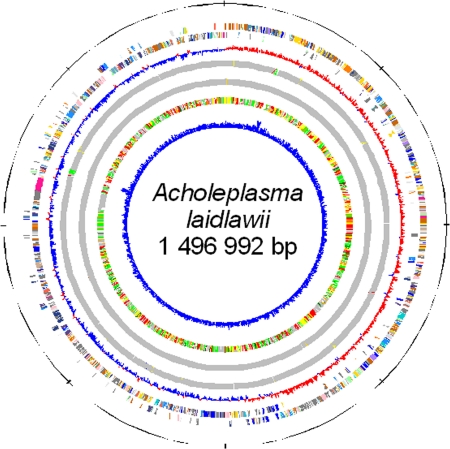
Fig. 1.
Circular representation of the A. laidlawii PG-8A genome. Circles 1 and 2 (counting from the outer side), the predicted coding sequences on the plus and minus strands, respectively, colored according to COG functional categories: translation, ribosomal structure, and biogenesis (gold); RNA processing and modification (orange); transcription (dark orange); DNA replication, recombination, and repair (maroon); cell division and chromosome partitioning (yellow); defense mechanisms (light pink); signal transduction mechanisms (purple); cell envelope biogenesis, outer membrane (peach); cell motility and secretion (medium purple); intracellular trafficking, secretion, and vesicular transport (dark pink); posttranslational modification, protein turnover, chaperones (light green); energy production and conversion (lavender); carbohydrate transport and metabolism (blue); amino acid transport and metabolism (red); nucleotide transport and metabolism (green); coenzyme metabolism (light blue); lipid metabolism (cyan); inorganic ion transport and metabolism (dark purple); secondary metabolites biosynthesis, transport, and catabolism (sea green); general function prediction only (light gray); function unknown (ivory); not in COGs (dark gray). Circle 3, GC skew ([G − C]/[G + C] using 1-kb sliding window); circle 4, tRNAs (green), rRNAs (red), T boxes (yellow), and riboswitches (blue); circle 5, IS elements (gold), groups of repeated sequences (the members of the same group are shown by the same color); circle 6, best-hit organisms, compared (BLASTP search) against the nonredundant database of previously sequenced genomes: Acholeplasmatales (yellow), Mycoplasmatales (pink), Bacillales (red), Lactobacillales (orange), Clostridiales (green), Thermoanaerobacteriales (dark green), all others displayed in gray; circle 7, G+C content (using 1-kb sliding window).

