
Figure 1.
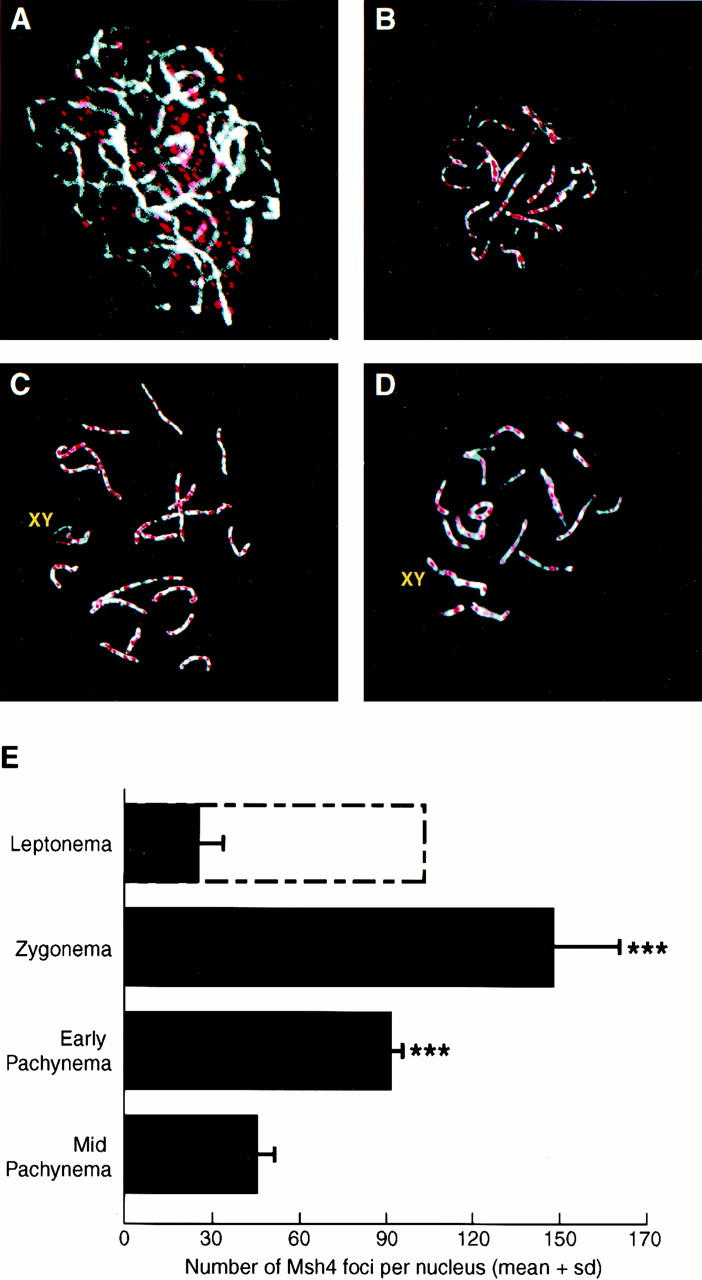
MSH4 localization on meiotic chromosomes during prophase I. (A–D) Immunofluorescent colocalization of MSH4 (red) and the synaptonemal complex protein COR1 (white) on chromosome spreads from wild-type spermatocytes at day 17 pp. (A) Leptonema; (B) zygonema; (C) early pachynema; (D) mid-pachynema. (E) Quantitation of foci associated with meiotic chromosomes during prophase I (mean ± s.d.). Solid bars represent mean number of foci associated with the COR1 protein at each stage of prophase I; the open bar represents the number of foci observed throughout the nucleus. One-way ANOVA reveals a high degree of significance across the stages (P < 0.0001). Asterisk indicate statistically significant differences from both leptotene foci (on chromosomes) and mid-pachytene foci (Dunn's multiple post-test, P < 0.001, n = 12 nuclei per genotype).