Fig. 1.
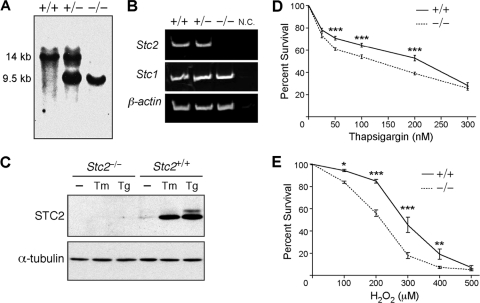
Characterization of Stc2−/− MEFs. (A) Southern blot of mouse tail DNA isolated from Stc2+/+, Stc2+/−, and Stc2−/− animals. (B) RT-PCR analysis of Stc2 expression in Stc2+/+, Stc2+/−, and Stc2−/− kidneys. N.C., negative control RT-PCR without reverse transcriptase. (C) Western blot analysis of STC2 expression in MEFs treated with Tm (2 μg/ml) or Tg (300 nM) for 16 h. WT and Stc2−/− MEFs were treated for 8 h with a range of concentrations of Tg (D) or H2O2 (E) to elicit ER or oxidative stress. Cell viability was determined using colorimetric WST-8 assays, and percent survival was calculated relative to that of untreated cells. Each point on the graph represents the means ± standard errors of the means (SEM) from at least three independent experiments. *, P < 0.05; **, P < 0.01; ***, P < 0.001 (each by one-way analysis of variance [ANOVA]).

