Fig. 2.
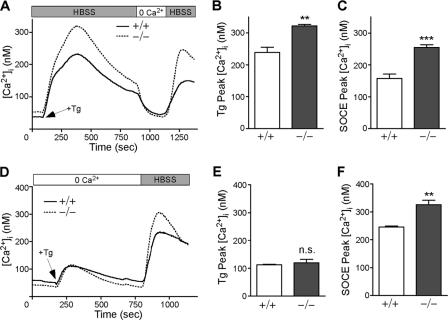
Stc2−/− MEFs display altered Ca2+ homeostasis. (A) WT and Stc2−/− MEFs loaded with 5 μM Fura-2 AM were treated with Tg (300 nM) in the presence of extracellular Ca2+ (1.3 mM Ca2+ HBSS), followed by perfusion with 0 Ca2+ HBSS and the add back of extracellular Ca2+ to trigger SOCE. Traces represent the averages from six to seven experiments each for WT and Stc2−/− MEFs. Average peak Ca2+ levels (means ± SEM) after the addition of Tg (B) or extracellular Ca2+ (C) for SOCE are shown. (D) WT and Stc2−/− MEFs were treated with Tg in the absence of extracellular Ca2+ before Ca2+ add back. Each trace represents averages from five experiments. Graphs represent average peak Ca2+ levels (mean ± SEM) after the addition of Tg (E) or extracellular Ca2+ (F) for SOCE. **, P < 0.01; ***, P < 0.001 (each by Student's t test).

