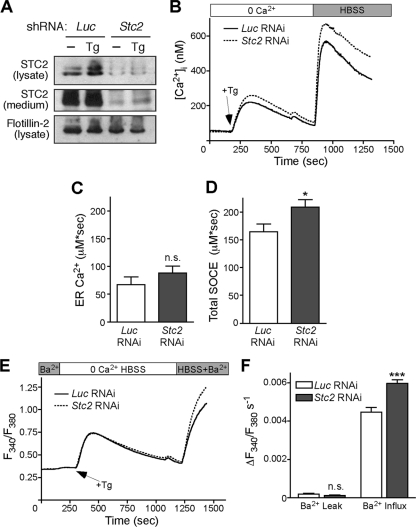
Fig. 4.
Knockdown of Stc2 expression in H19-7 cells increases SOCE. (A) Analysis of STC2 expression in stable luciferase (Luc) and STC2 RNAi pools at steady state and following treatment with Tg (300 nM) to induce ER stress. Aliquots of cell lysates and immunoprecipitates of conditioned medium were analyzed by immunoblotting. (B) Differentiated H19-7 pools of cells stably expressing STC2 or Luc shRNA were loaded with 5 μM Fura-2 AM. Cells then were perfused with 0 Ca2+ HBSS followed by treatment with Tg in 0 Ca2+ HBSS. After store depletion, HBSS was added to trigger SOCE. Each trace represents the averages from 12 experiments. Graphs represent total [Ca2+]i increases (area under the curve) after Tg addition (C) or Ca2+ add back (D). *, P < 0.05 by Student's t test; n.s., not significant. (E) Differentiated H19-7 cells stably expressing STC2 or Luc shRNA were loaded with 5 μM Fura-2 AM. Cells then were perfused with 0 Ca2+ HBSS plus 2 mM BaCl2 followed by treatment with Tg (1 μM) in 0 Ca2+ HBSS. Following store depletion, 0 Ca2+ HBSS plus 2 mM BaCl2 was added back to trigger SOCE. Each trace represents the averages from six experiments. (F) Ba2+ influx rates were calculated by subtracting the linear portion of the slope before Tg addition (Ba2+ leak) from the slope after Tg addition. **, P < 0.01; ***, P < 0.001 (each by one-way ANOVA).

