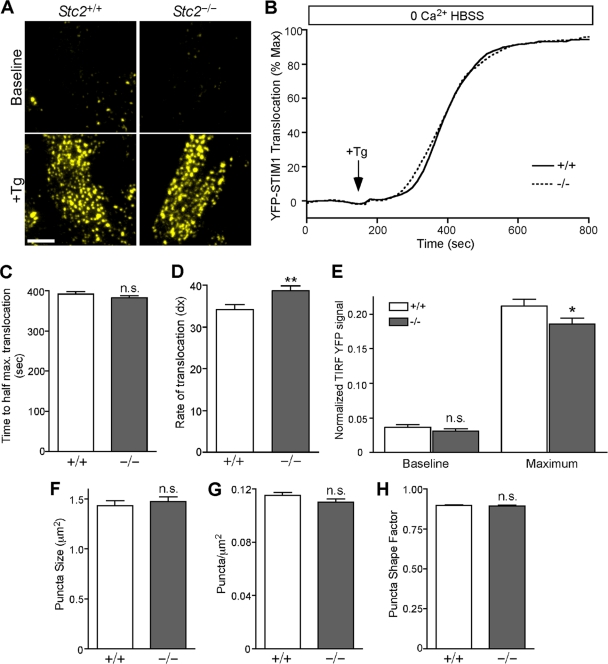
Fig. 7.
STIM1 translocation is not potentiated in Stc2−/− MEFs following store depletion. (A) WT and Stc2−/− MEFs stably expressing YFP-STIM1 were imaged by TIRF microscopy. Representative TIRF images are shown before and after ER Ca2+ store depletion by the addition of Tg. Scale bar, 10 μm. (B) Time-lapse TIRF images of transfected WT and Stc2−/− MEFs treated with Tg (300 nM) in 0 Ca2+ HBSS were acquired to measure the translocation of YFP-STIM1 to puncta near the plasma membrane. Total YFP TIRF intensity was quantified, and STIM1 translocation was plotted over time and normalized to the maximum YFP-STIM1 TIRF signal. Traces represent the averages from 12 experiments, with ∼6 to 12 cells/experiment. (C and D) Data from individual cells were fit using a Boltzmann sigmoidal function, and the time to half-maximal translocation (C) and the rate constant (dX) (where dX is equal to the change in time corresponding to the greatest change in STIM1 translocation, such that larger dX values correspond to lower rates of translocation) (D) were calculated and compared between WT and Stc2−/− MEFs. (E) Total translocated STIM1 values at baseline and at maximum were quantified by the normalization of TIRF YFP signals to wide-field fluorescence. n.s., not significant. *, P < 0.05; **, P < 0.01 (each by Student's t test). (F to H) Quantification of YFP-STIM1 puncta size (F), density (G), and shape factor (H), where 1 is equal to a perfect circle, in WT and Stc2−/− MEFs following store depletion.

