Fig. 5.
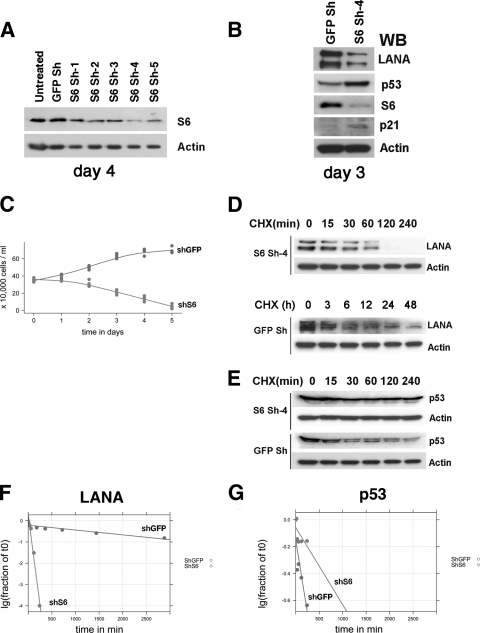
Analysis after knockout of RPS6. (A) BC-3 cells were transduced with five recombinant lentiviruses (S6 Sh-1 to Sh-5) encoding different shRNAs directed against RPS6 in six-well plates. shRNAs against GFP-encoding lentivirus and untreated BC-3 cells were used as controls. Western blot analysis was performed 4 days postransduction using anti-RPS6 (S6) and anti-β-actin (Actin) antibodies. (B) Western blots were performed 3 days after knockdown of RPS6 with shRNA no. 4, probing with anti-LANA, anti-p53, anti-p21, and anti-β-actin antibodies, respectively, at 3 days postransduction. (C) Proliferation of BC-3 cells was measured at different time points following shRNA-mediated RPS6, as described above. The number of cells is shown on the y axis, and the time after transduction is shown on the x axis. The cells were not refed in between time points. (D) Protein stability analysis of LANA. BC-3 cells were transduced with anti-RPS6 (S6 Sh-4) shRNA vector or control shRNA vector (GFP Sh) and exposed to cycloheximide (CHX) starting at day 3 postransduction, and LANA and actin protein levels were determined by Western blot analysis at the indicated times (in hours). (E) Protein stability analysis of p53. BC-3 cells were transduced with anti-RPS6 (S6 Sh-4) shRNA vector or control shRNA vector (GFP Sh) and exposed to cycloheximide and LANA, and actin protein levels were determined by Western blot analysis at the indicated times (in minutes). (F) Protein stability determination for LANA and p53 (G). The protein bands in panels D and E were scanned, and band intensities were calculated. The log10 band intensity of the fraction at time zero is shown on the y axis, and time is shown on the x axis. Lines represent the robust fit of the data.

