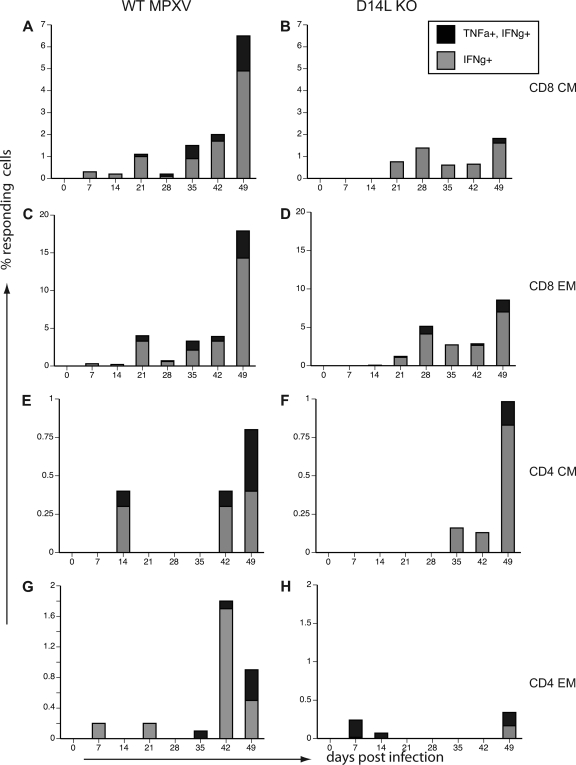
Fig. 8.
MPXV-Z-specific T cells in BAL fluid of WT and D14L KO MPXV-Z-infected animals. ICCS was performed as described for Fig. 7 to measure frequency of MPXV-specific T cells in BAL fluid of WT and D14L KO MPXV-Z-infected animals. (A, C, E, and G) Average percentage of responding (TNF-α+ IFN-γ+ double-positive or IFN-γ+ only) T-cell subsets in BAL fluid of WT MPXV-Z-infected animals 24739 and 22510. (B, D, F, and H) Frequency of responding T cells from D14L KO MPXV-Z-infected animal 22665.

