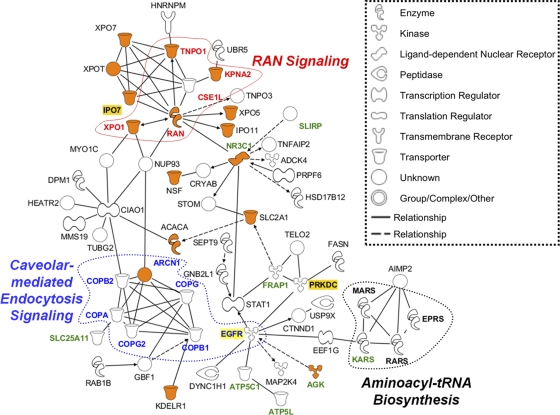
Fig. 3.
The cellular PA-interaction networks. The cellular interaction networks of PA-specific binding partners are shown. Represented in this analysis is a subset of the 166 cellular proteins which bound to PA in an RNA-independent manner and which were identified in all three protein preparations studied (Fig. 2). The analysis shown here reveals a novel interaction of PA with members of the Ran signaling pathway, the caveolar endocytosis-mediated pathway, and the aminoacyl-tRNA biosynthesis pathway. Orange symbols represent molecules that are involved in molecular transport. Highlighted in green are mitochondrial proteins, and highlighted in yellow are molecules chosen for further analysis (IPO7 and PRKDC) or discussed further in the text (EGFR). Nodes depict proteins in the network, and solid lines represent direct whereas dotted lines represent indirect relationships between the proteins. An arrow pointing from one node to the next signifies an activation event, such as phosphorylation or methylation. For simplicity, self-binding or autoregulation events were not included in this figure.

