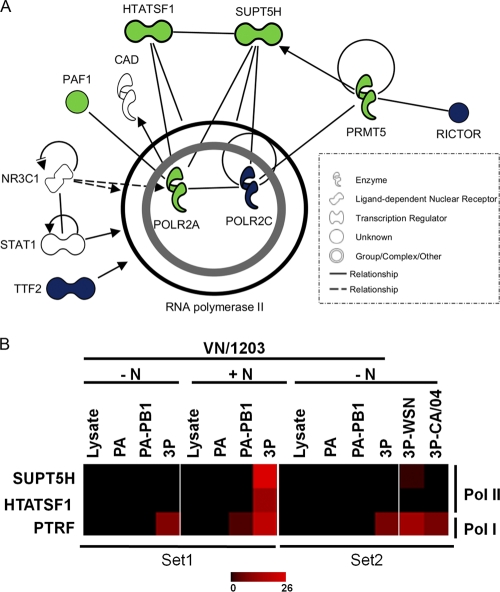
Fig. 8.
Pol II interaction network of PA-PB1- and 3P-associated host factors. (A) Proteins shown were identified in association with the following affinity-purified polymerase subunits/preparations: PA-PB1 fraction, blue; 3P fraction, green; PA fraction, white. Nodes depict proteins in the network, and solid lines represent direct whereas dotted lines represent indirect relationships between the proteins. An arrow pointing from one node to the next signifies an activation event, such as phosphorylation or methylation. (B) The relative abundances (spectral counts) of Pol II and Pol I factors are shown in the form of a heat map. The spectral counts are shown from samples across both experimental sets (set 1 and set 2).

