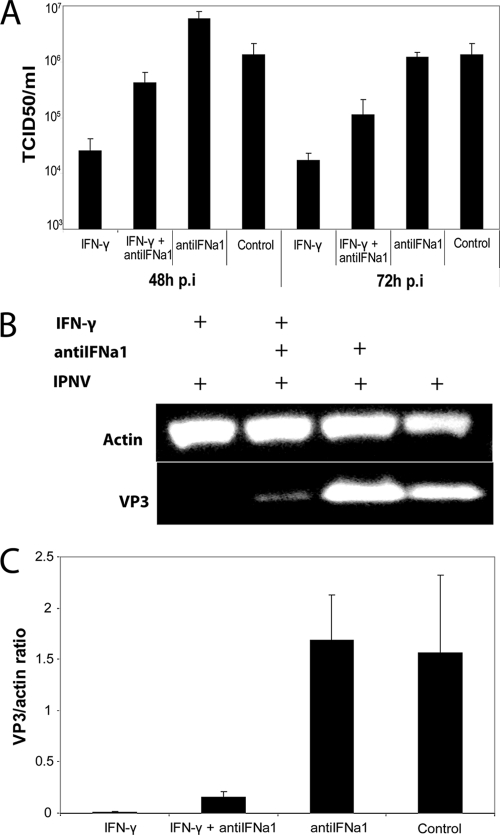
Fig. 3.
Antiviral activity of IFN-γ measured as the reduction in virus titers and the expression of viral VP3 protein. (A) TO cells were pretreated for 24 h with 100 ng of IFN-γ/ml with or without antiIFNa1, before infection with IPNV (MOI of 0.1). Supernatants were harvested 48 and 72 h p.i. and titrated on CHSE cells. The results show the mean TCID50/ml values of three replicate wells from the same setup. Control was untreated, infected cells. (B) TO cells were pretreated for 24 h with 100 ng of IFN-γ/ml with or without antiIFNa1, before infection with IPNV (MOI of 0.1). Lysates were harvested 48 h p.i. and subjected to Western blot analysis. The figure shows results from one representative parallel from the same setup as in panel A. (C) The actin and VP3 bands from the Western blot analysis in panel B were quantified, and the results show the mean VP3/actin ratio of three replicate wells from the same setup. The control was untreated, infected cells.

