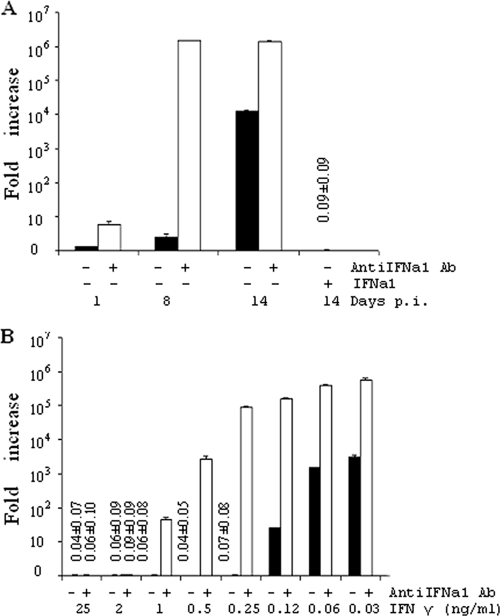
Fig. 5.
Inhibition of SAV3 replication by IFN-γ and IFNa1. (A) TO cells were infected with SAV3 in the absence (■) or presence (□) of antiIFNa1 antibody or 24 h after stimulation with IFNa1 (1 ng/ml). (B) TO cells were infected with SAV3 after stimulating with IFN-γ (24 h) with or without antiIFNa1 and sampled 14 days p.i. Bars show the fold increase in virus nsP1 transcripts measured by qPCR related to non-IFN-treated cells at day 1 p.i. Treatments and time points for sampling are indicated underneath bars (n = 3).

