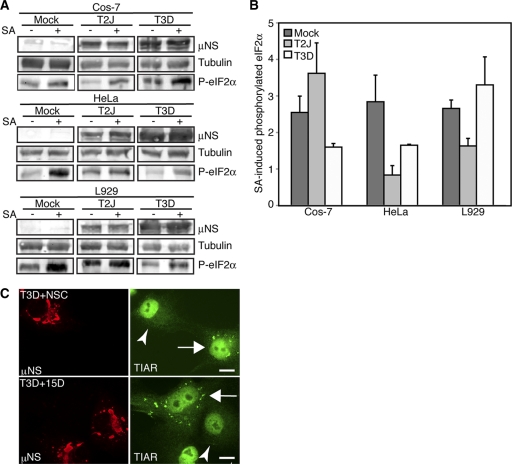
Fig. 4.
MRV interferes with SGs downstream of eIF2α phosphorylation. (A) Cos-7, HeLa, or L929 cells were mock infected or infected with MRV T2J or T3D. At 24 h.p.i., the cells were left untreated or treated with SA for 1 h. Samples were harvested, and proteins were separated on SDS-PAGE and electroblotted to nitrocellulose. The nitrocellulose membranes were immunoblotted with rabbit α-μNS polyclonal antiserum, rabbit α-tubulin polyclonal antibodies, and rabbit α-phosphorylated (P) eIF2α polyclonal antibodies, as indicated, followed by goat α-rabbit IgG conjugated with AP, and bound AP conjugates were detected by chemiluminescence. (B) AP conjugates from panel A were quantified with Quantity-One software. Quantified amounts of phosphorylated eIF2α were divided by quantified amounts of α-tubulin to adjust for differences in gel loading. Fold increases in levels of phosphorylated eIF2α in SA-treated cells relative to untreated cells were calculated, and the means and standard deviations of two experimental replicates are shown. (C) Cos-7 cells were infected with MRV T3D, and at 24 h p.i., the cells were treated with either NSC119893 (top row) or 15D-PGJ2 (bottom row) for 1 h and then fixed and immunostained with rabbit α-μNS polyclonal antiserum (left column) and goat α-TIAR polyclonal antibody (right column), followed by Alexa 594-conjugated donkey α-rabbit IgG and Alexa 488-conjugated donkey α-goat IgG. The arrowheads identify infected cells that do not contain SGs. The arrows identify uninfected cells that do contain SGs. Bars = 10 μm.

