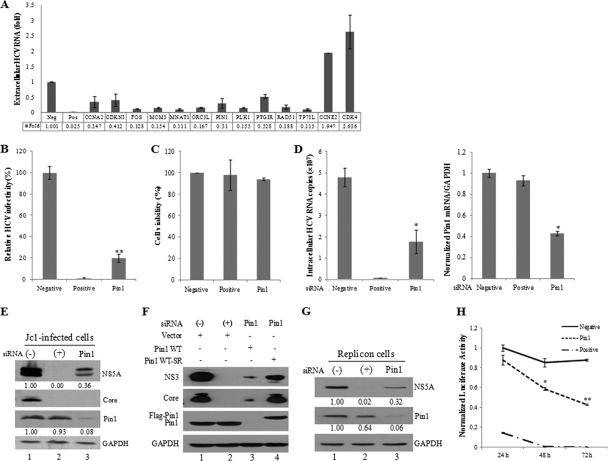
Fig. 1.
Pin1 is essential for HCV replication. (A) Huh7.5 cells were transfected with 20 nM siRNAs for 48 h and were then infected with HCV Jc1 for 4 h. At 2 days postinfection, culture supernatants were collected, and extracellular HCV RNAs were quantified by qPCR. From the siRNA library targeting 131 human cell cycle genes, 13 siRNAs that altered (increased or decreased) the level of HCV production 2-fold from that for the negative control were selected. (B) Huh7.5 cells were transfected with 20 nM negative (−), positive (+), or Pin1 siRNA duplexes for 48 h, followed by infection with Jc1 for 4 h. At 2 days postinfection, HCV infectivity was determined by a focus-forming assay. (C) Huh7.5 cells were transfected with the indicated siRNAs. At 96 h after transfection, cell viability was assessed by an MTT assay. (D) Both intracellular RNA (left) and Pin1 mRNA (right) isolated from cells treated as described in the legend to panel B were analyzed by qPCR. (E) Total-cell lysates harvested from cells treated as described in the legend to panel B were immunoblotted with the indicated antibodies. (F) Huh7.5 cells were transfected with the indicated siRNA. At 2 days after siRNA transfection, cells were infected with Jc1 for 4 h and were then transfected with 3 μg of a vector or plasmid expressing wild-type Pin1 (Flag-Pin1 WT) or siRNA-resistant Pin1 (Flag-Pin1 WT-SR). Protein expression was determined by immunoblot analysis at 2 days after transfection. (−), the universal negative-control siRNA; (+), siRNA targeting the 5′ NTR of Jc1 as a positive control. (G) Subgenomic replicon cells were transfected with the indicated siRNAs for 96 h. Protein expression was determined by immunoblot analysis. The band intensity was quantified using ImageJ software. (H) Huh7.5 cells were transfected with in vitro-transcribed HCV-Luc RNA. At 2 days after transfection, cells were transfected with a negative-control, positive-control, or Pin1 siRNA. Luciferase activity was measured at the indicated times. Asterisks indicate significant differences (*, P < 0.05; **, P < 0.01) from activity for the negative control.

