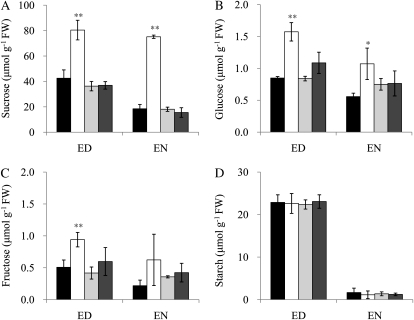
Figure 6.
Leaf soluble sugar and starch contents in ossut2 mutant plants grown for 4 weeks in the greenhouse. The levels of Suc (A), Glc (B), Fru (C), and starch (D) are shown. Each data point represents the mean ± sd from five different plants. ED, End of the day; EN, end of the night; FW, fresh weight. Black bars, The wild type (WT); white bars, ossut2; light gray bars, Comp-3; dark gray bars, Comp-4. The statistical significance of correlation coefficients is indicated by asterisks: * P < 0.05, ** P < 0.01.

