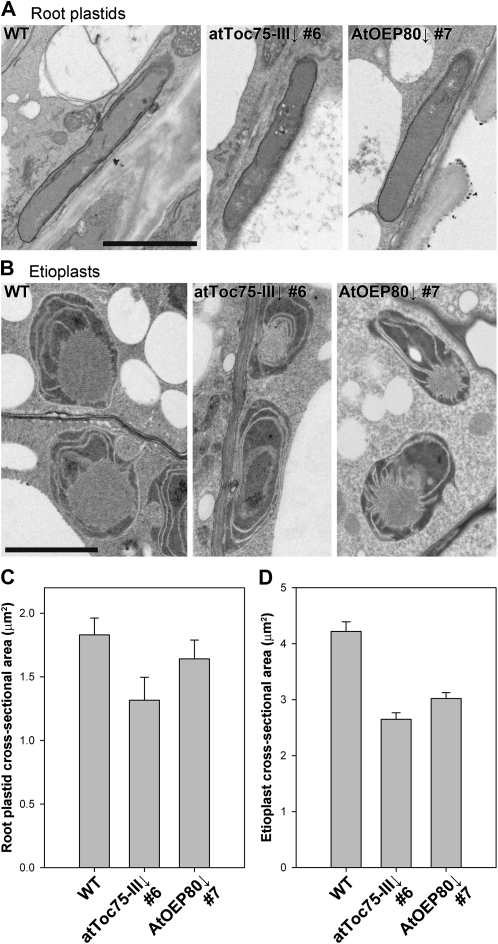
Figure 4.
Morphology of nonphotosynthetic plastids in atToc75-III↓ and AtOEP80↓ plants. A and B, Representative electron micrographs of root plastids (A) and etioplasts (B) in wild-type, atToc75-III↓ number 6, and AtOEP80↓ number 7 plants. Images were derived from plants grown on MS-dexamethasone medium, either in the light for 10 d (A) or in the dark for 5 d (B). Approximately five whole-organelle micrographs from each of at least three independent plants per genotype were analyzed carefully, in each case, and used to select the representative images shown. Scale bars = 2 μm. C and D, Quantification of root plastid (C) and etioplast (D) electron micrographs. Values shown are means (±se) derived from measurements of 14 to 37 different plastids per genotype, in each case.

