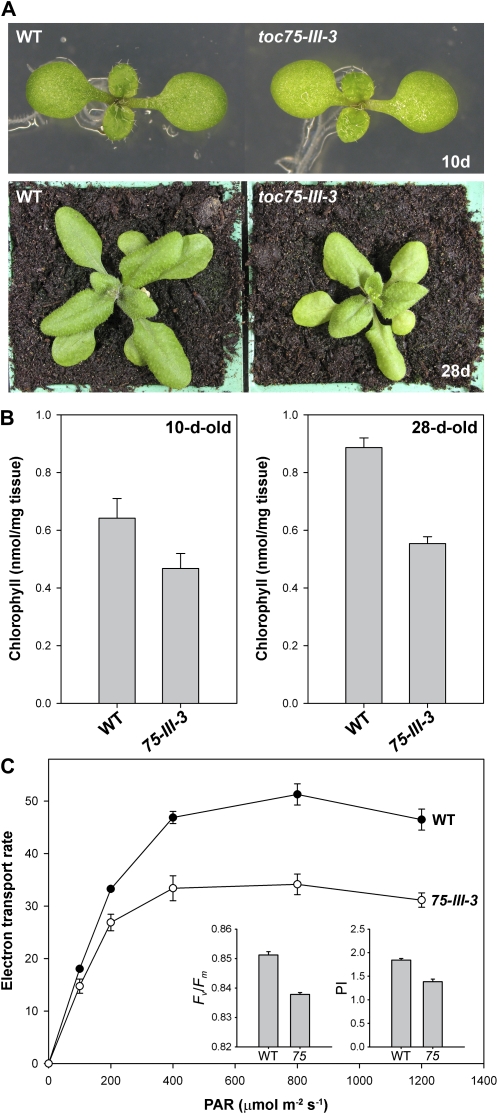
Figure 6.
Analysis of photosynthetic development in the toc75-III-3 (mar1) mutant. A, Plants of the indicated genotypes were grown side by side, in vitro, for 10 d, and then photographed. Additional plants were transferred to soil on day 14 and allowed to grow for a further 2 weeks prior to photography on day 28. Representative plants are shown in each case. B, Chlorophyll concentrations in 10- and 28-d-old plants similar to those described in A were determined photometrically. Values shown are means (±se) derived from three independent samples, each one containing eight plants. Units are nmol chlorophyll a + b per mg fresh weight. C, Analysis of photosynthesis in the toc75-III-3 mutant. Light response curves of photosynthetic electron transport rates in wild-type and mutant plants were determined by measuring chlorophyll fluorescence. Values were recorded at different irradiances of photosynthetically active radiation (PAR), ranging from 0 to 1,200 μmol photons m−2 s−1. Units for the data shown are μmol electrons m−2 s−1, assuming 84% absorption of the incident light and equal distribution of the energy between the two photosystems (Meyer et al., 1997). The insets show PSII photochemical efficiency (Fv/Fm) and photosynthetic performance index readings for similar plants. Developmentally similar leaves (seventh or eighth true leaf) of 28-d-old plants grown under identical conditions were employed for all measurements. Values shown are means (±se) derived from five independent measurements.

