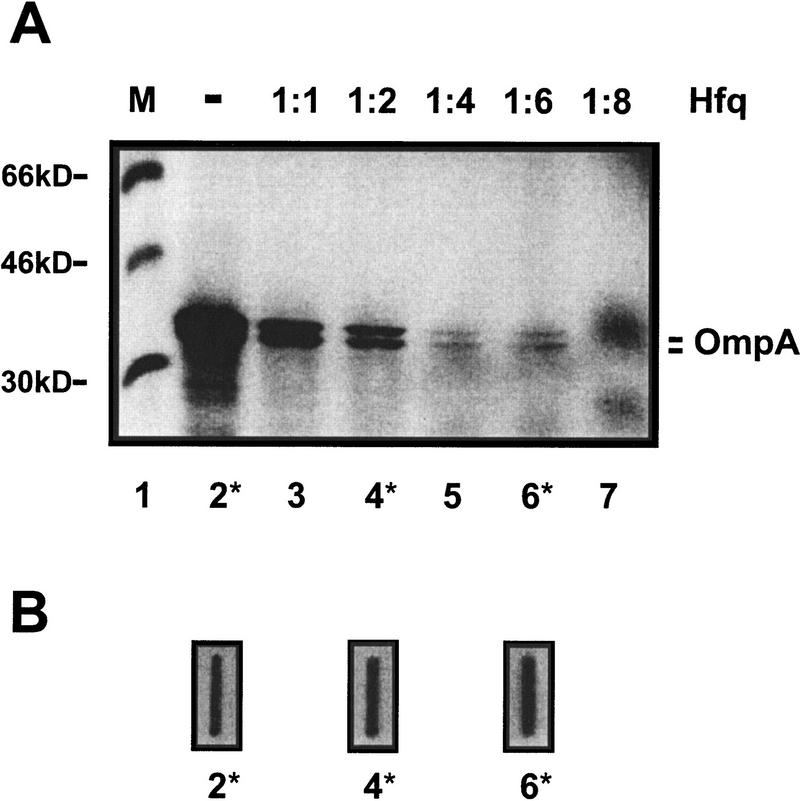
Figure 5.
In vitro translation of ompA mRNA in the presence of Hfq. (A) The positions and molecular masses (in kD) of marker proteins (M; lane 1) and of the two OmpA-specific bands are given at the left and at the right, respectively. (Lane 2) In vitro translation of ompA mRNA in the absence of Hfq; (lanes 3–7) In vitro translation of ompA mRNA in the presence of Hfq. Hfq was added to mRNA at different molar ratios as shown on top of the autoradiograph of the 12.5% SDS–polyacrylamide gel. (B) Slot–blot hybridizations showing that the ompA mRNA was not degraded in the S30 extracts upon addition of Hfq. The mRNA concentrations in the slot–blots marked with 2*, 4*, and 6* were directly determined after completion of the translation reactions shown in lanes 2*, 4*, and 6* of A as described in Materials and Methods.

