Figure 4.
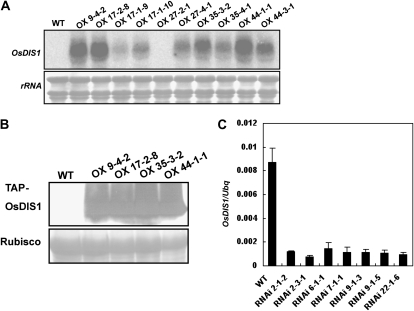
Expression analysis of OsDIS1 T3 homozygous overexpression plants and RNAi plants. A, The expression of OsDIS1 in the overexpression plants as determined by RNA gel blot. Total RNA (10 μg per sample) was loaded onto a 1.2% agarose gel, and the nylon membrane was hybridized with a 32P-labeled OsDIS1 probe (full-length coding sequence). The 28s rRNA was used as a loading control. OX denotes OsDIS1 overexpression transgenic lines. B, The expression of OsDIS1 in the overexpression plants as determined by western blot. The total protein was prepared from 10-d-old rice seedlings and subjected to SDS-PAGE, followed by immunoblot analysis using peroxidase anti-peroxidase antibody. Rubisco protein stained with Ponceau S was used as a loading control. C, The expression of OsDIS1 in the RNAi plants as determined by real-time PCR. The relative expression level of OsDIS1 was compared in the RNAi transgenic plants and the wild type (WT) using Ubq as an internal control.

