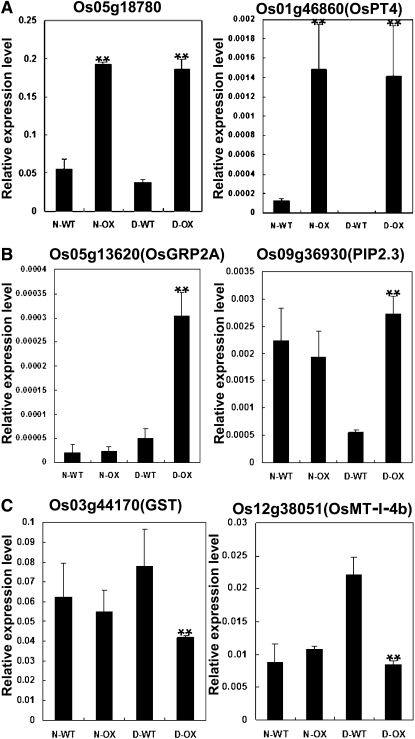
Figure 6.
Real-time PCR confirmation of differentially expressed genes in the OsDIS1 overexpression plants under normal and drought conditions. A, Specifically induced genes in the OsDIS1 overexpression plants under normal conditions. B, Induced genes in the OsDIS1 overexpression plants under drought conditions. C, Suppressed genes in the OsDIS1 overexpression plants under drought conditions. N denotes the normal condition, D denotes the drought condition, WT denotes wild-type plants, and OX denotes OsDIS1 overexpression transgenic lines. ** t test, with P < 0.01; * t test, with P < 0.05.

