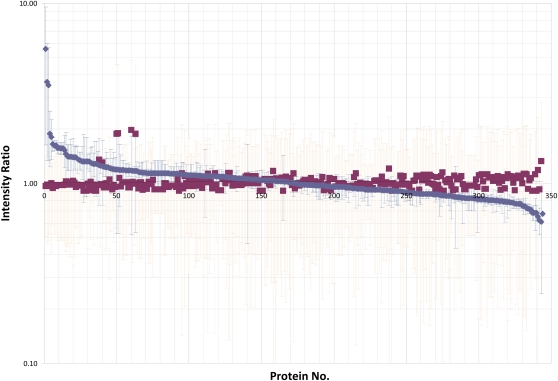
Figure 4.
A comparison of the ratios of proteins in the leaves of glyphosate-sensitive (PAN) plants, 5 d after spraying with either water (blue squares and blue error bars) or glyphosate (red squares and red error bars). Red squares represent averages of three different reporter ion ratios stemming from the derivatization of water-control soybean leaves with TMT reagents 126, 127, and 128. Blue squares represent reporter ion ratios for glyphosate-treated soybean leaves derivatized with TMT reagents 129, 130, and 131. Red error bars represent se.

