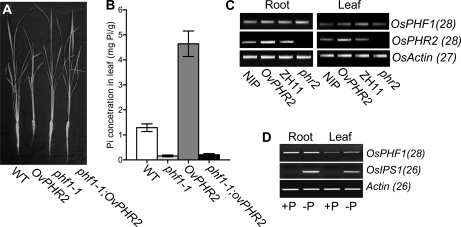
Figure 6.
OsPHF1 is not regulated downstream of OsPHR2 at transcriptional level. A, Growth performance of 30-d-old plants of the wild type (WT), OvPHR2, Osphf1-1, and phf1-1;OvPHR2 plants grown in a solution culture supplied with 200 μm Pi. B, Cellular Pi concentration in the leaves of 30-d-old wild type, OvPHR2, Osphf1-1, and phf1-1;OvPHR2 grown in a solution culture supplied with 200 μm Pi. C, RT-PCR analysis of the expression levels of OsPHR2 and OsPHF1 in roots of the wild type (Nipponbare: NIP and Zhonghua 11: ZH11), OvPHR2 and phr2 mutant plants grown in a solution culture supplied with 200 mm Pi. The primers specific to the genes analyzed are listed in Supplemental Table S3. The transcript level of the Actin gene after 27 PCR cycles was used as a control. D, RT-PCR analysis of the expression levels of OsPHF1 and OsIPS1 in the root and leaf of the wild-type plants grown in a solution culture with Pi-supplied (+P) and Pi-deficient (−P) conditions. The primers specific to the genes analyzed are listed in Supplemental Table S3.

